The Duke University and The Media Trust research team have continued to track malware activity from undesired third-party code against internet users. This blog aims to update our readers on the recent activity and trends observed from May and June. The reader can find previous updates and more on the Media Trust project on our website here. At the bottom of the page are graphs for clarity on some data trends. As spring ends and we head into the beginning of summer, a significant shift in the data occurred. The major highlight of last month’s update was the lull in Unique and Total incidents. There was a moderate decline in total and unique incidents from winter into spring. Total and Unique Incidents will commonly come into a lull during spring. As noted last time, this attack drop follows a similar trend to what happened in 2021. Entering late spring and early summer downward trend entirely reversed.
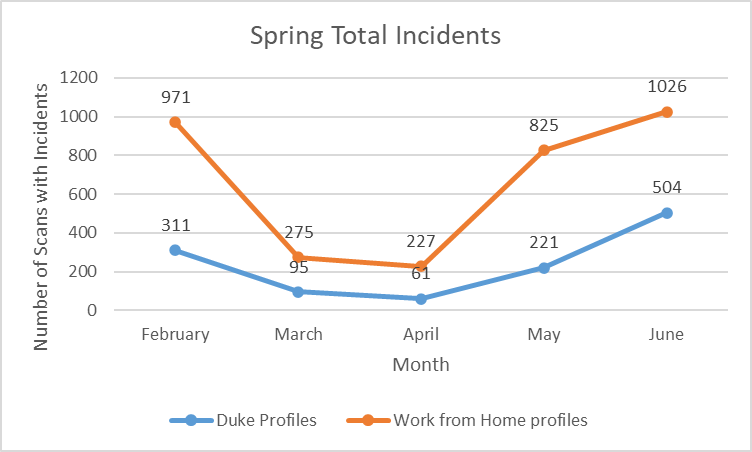
After the heavy slump in April, the number of Total incidents on our Duke network increased by an astonishing 262% from April to May and then had another huge 128% increase for June. The Work From Home profile’s total incidents had an even more significant growth margin. From April to May, the Total incidents increased by 263% and then again increased by 24% from May to June. The graph below shows the slight decline slump of the spring months and then the steep jump in attacks recently.
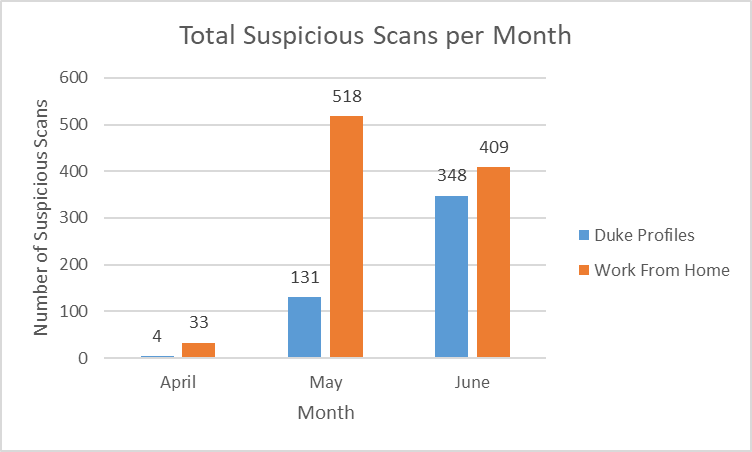
The considerable jump in Total scans is mirrored by a significant increase in the Suspicious Activity scans. This scan flags Heuristics on new and modified versions of existing threats. A chart is provided below to show the considerable increase in Suspicious activity.
The number of Unique Scans across both Duke and Work from Home networks has also increased since the end of spring. However, at a less dramatic rate. Duke and Work from Home networks increased by 75% and 54%, respectively, across the two months. The chart below displays the change in Unique incident reports which follow a similar trend. However, the less extreme trend to that of Total attacks.

Unlike the total attacks, there was almost no indication of a specific attack vector increasing significantly. The overall majority of phenomena on the scans increased at similar rates, which means that one vector is not necessarily to blame for the sudden increases in attacks.
The uptick in scans at the beginning of summer follows very closely in a continuation of what happened in the summer of 2021. However, much less extreme. (To see trend lines of all data collected, go to this page) We have commonly seen a dip in the spring months to see the number of attacks significantly increase at the beginning of summer. One possible explanation is that come summertime; ad inventory is cheap. This is often due to the occurrence of events and holidays that reduce the attractiveness of online advertising to commercial entities. This allows potential threats to purchase and use ad spam to move malware and target more people very cheaply. This means the average user becomes more likely to run into ad space carrying potentially harmful code.
Other less significant but still noteworthy trends include the emergence of another new type of phenomenon not seen before, detection by 3rd party. This is potential foul content detected by 3rd parties The new types highlighted in the last update, Malicious codes: E – skimming and Out of browser re-direct, still appeared on this month’s scans; however, they only occur at minimal, relatively nominal rates. The new phenomena arising so far are isolated to Work from home profiles, but we will continue to track and note if they become more prevalent.
The major takeaway from these two months is the sharp increase in Total and Unique scans. We will continue to track the sharp increase in data until the end of the summer to see if the numbers level out or if the trend continues.